The Report Totals panel controls which figures appear in the totals block at the top of the email, and whether each one is compared to the previous period.
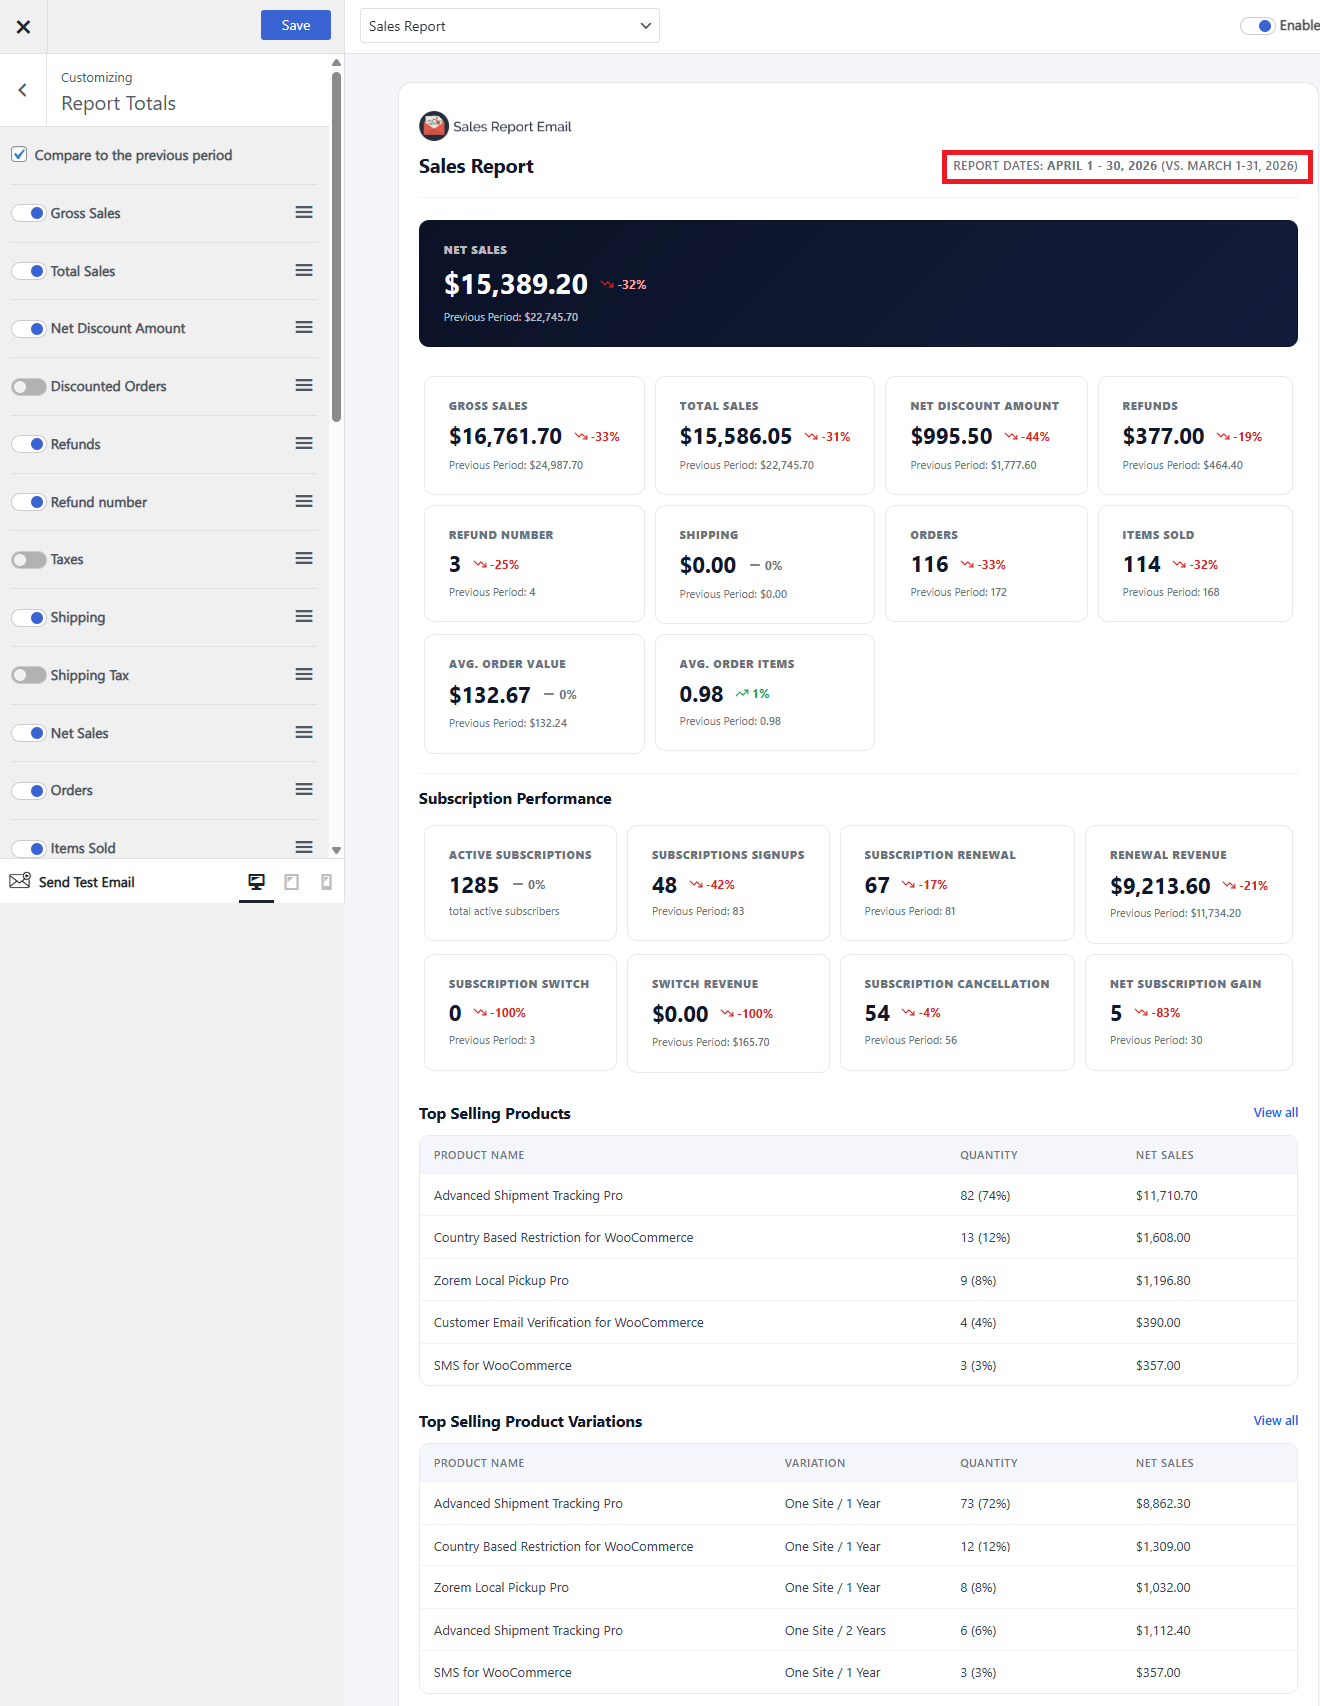
Where the numbers come from
Every figure below is read from the WooCommerce Analytics tables — the same source as Analytics > Revenue in your WooCommerce admin. Three things follow from that, and they explain almost every “the numbers don’t match” question:
- Analytics must be fully imported. If WooCommerce is still importing historical data, or the import stalled, your reports will be short. Check WooCommerce > Status > Scheduled Actions and the Analytics settings before assuming a report is wrong.
- Only Completed, Processing and On hold orders count toward sales figures. Pending, Cancelled, Failed and Draft orders are excluded. Refunded orders are counted in the refund figures.
- The date used is the one WooCommerce Analytics is set to use — see below.
Which date a report uses
Email Reports follows the date type set in Analytics > Settings. That setting can be date created, date paid or date completed, and WooCommerce defaults it to date paid. So an order placed on the 1st and paid on the 2nd lands in the 2nd’s report on a default store.
If your report totals look shifted by a day against what you expect, this setting is usually why. Changing it changes both Analytics and your reports, so they stay consistent with each other.
Report totals reference
| Total | What it means |
|---|---|
| Gross Sales | Sale price of the products multiplied by quantity ordered. Excludes refunds, coupons, taxes and shipping. |
| Total Sales | Gross Sales − Refunds − Coupons + Taxes + Shipping. This is the only total that includes tax and shipping. |
| Net Sales | Gross Sales − Refunds − Coupons. Excludes tax and shipping. Called “Sales” in the legacy WooCommerce reports. |
| Net Sales This Month | The same calculation as Net Sales, but always for the current calendar month to date, whatever period the rest of the report covers. |
| Net Discount Amount | Total of all discounts from coupons. |
| Discounted Orders | Number of orders with a coupon applied. |
| Refunds | Money returned to customers over the period. |
| Refund number | How many refunds were issued over the period, as a count rather than an amount. |
| Taxes | Total tax charged. |
| Shipping | Total shipping charged, excluding tax on shipping. |
| Shipping Tax | Tax applied to shipping. Counted separately, so it is not part of the Shipping figure. |
| Orders | Number of orders placed in the period with a counted status (Completed, Processing or On hold). |
| Items Sold | Number of individual items sold, not the number of orders. |
| New Customers | Number of registered customer accounts created during the period. Guest checkouts are not counted, because no account is created. |
| Average Order Value | Net Sales ÷ Orders. |
| Avg. Daily Sales | Net Sales ÷ the number of days in the report period. |
| Avg. Items per order | Items Sold ÷ Orders. |
| Downloads | Number of downloadable files downloaded in the period. |
One term, throughout: money given back to a customer is a refund. Older versions of this page used “returns” in the formulas and “refunds” in the labels — they mean the same thing.
How the averages behave
Avg. Daily Sales and Avg. Items per order divide by the length of the report period, so what they mean depends on the schedule:
| Schedule | What the average covers |
|---|---|
| Weekly / Monthly | The full week or month the report covers. |
| Last 30 days | All 30 days, so the average is stable from one send to the next. |
| Month to date | Only the days elapsed so far this month. Early in the month the average moves a lot, because it is dividing by very few days. |
| Manual date range | The number of days in the range you picked. |
Next: Report Details — the tables that appear under the totals.