The Returns Analytics Dashboard provides a complete, real-time view of your store’s return and exchange activity. It helps you measure the financial impact of returns, identify the products that are returned most often, and track the most common reasons customers send items back. The dashboard is integrated directly into the WooCommerce Analytics interface and supports flexible date ranges with period-over-period comparisons.
Use this dashboard to:
- Track Total Returns – See the total number of return requests for any selected period.
- Monitor Return Rate – Understand what percentage of orders result in a return.
- Measure Revenue Impact – View how much revenue was lost to refunds vs. retained through exchanges or store credit.
- Identify Problem Products – Find your most-returned products along with their return rate and top return reason.
- Spot Trends Over Time – Use line and bar charts to visualize return volume and resolution status across the selected period.
- Compare Performance – Compare the current period against the previous period or the previous year automatically.
Navigate to Analytics > Returns
Key Features:
- Date Range Selector: Choose from preset ranges (Today, Yesterday, Week to date, Last week, Month to date, Last month, Quarter to date, Last quarter, Year to date, Last year) or define a custom range. Each range is automatically compared to the previous period or previous year.
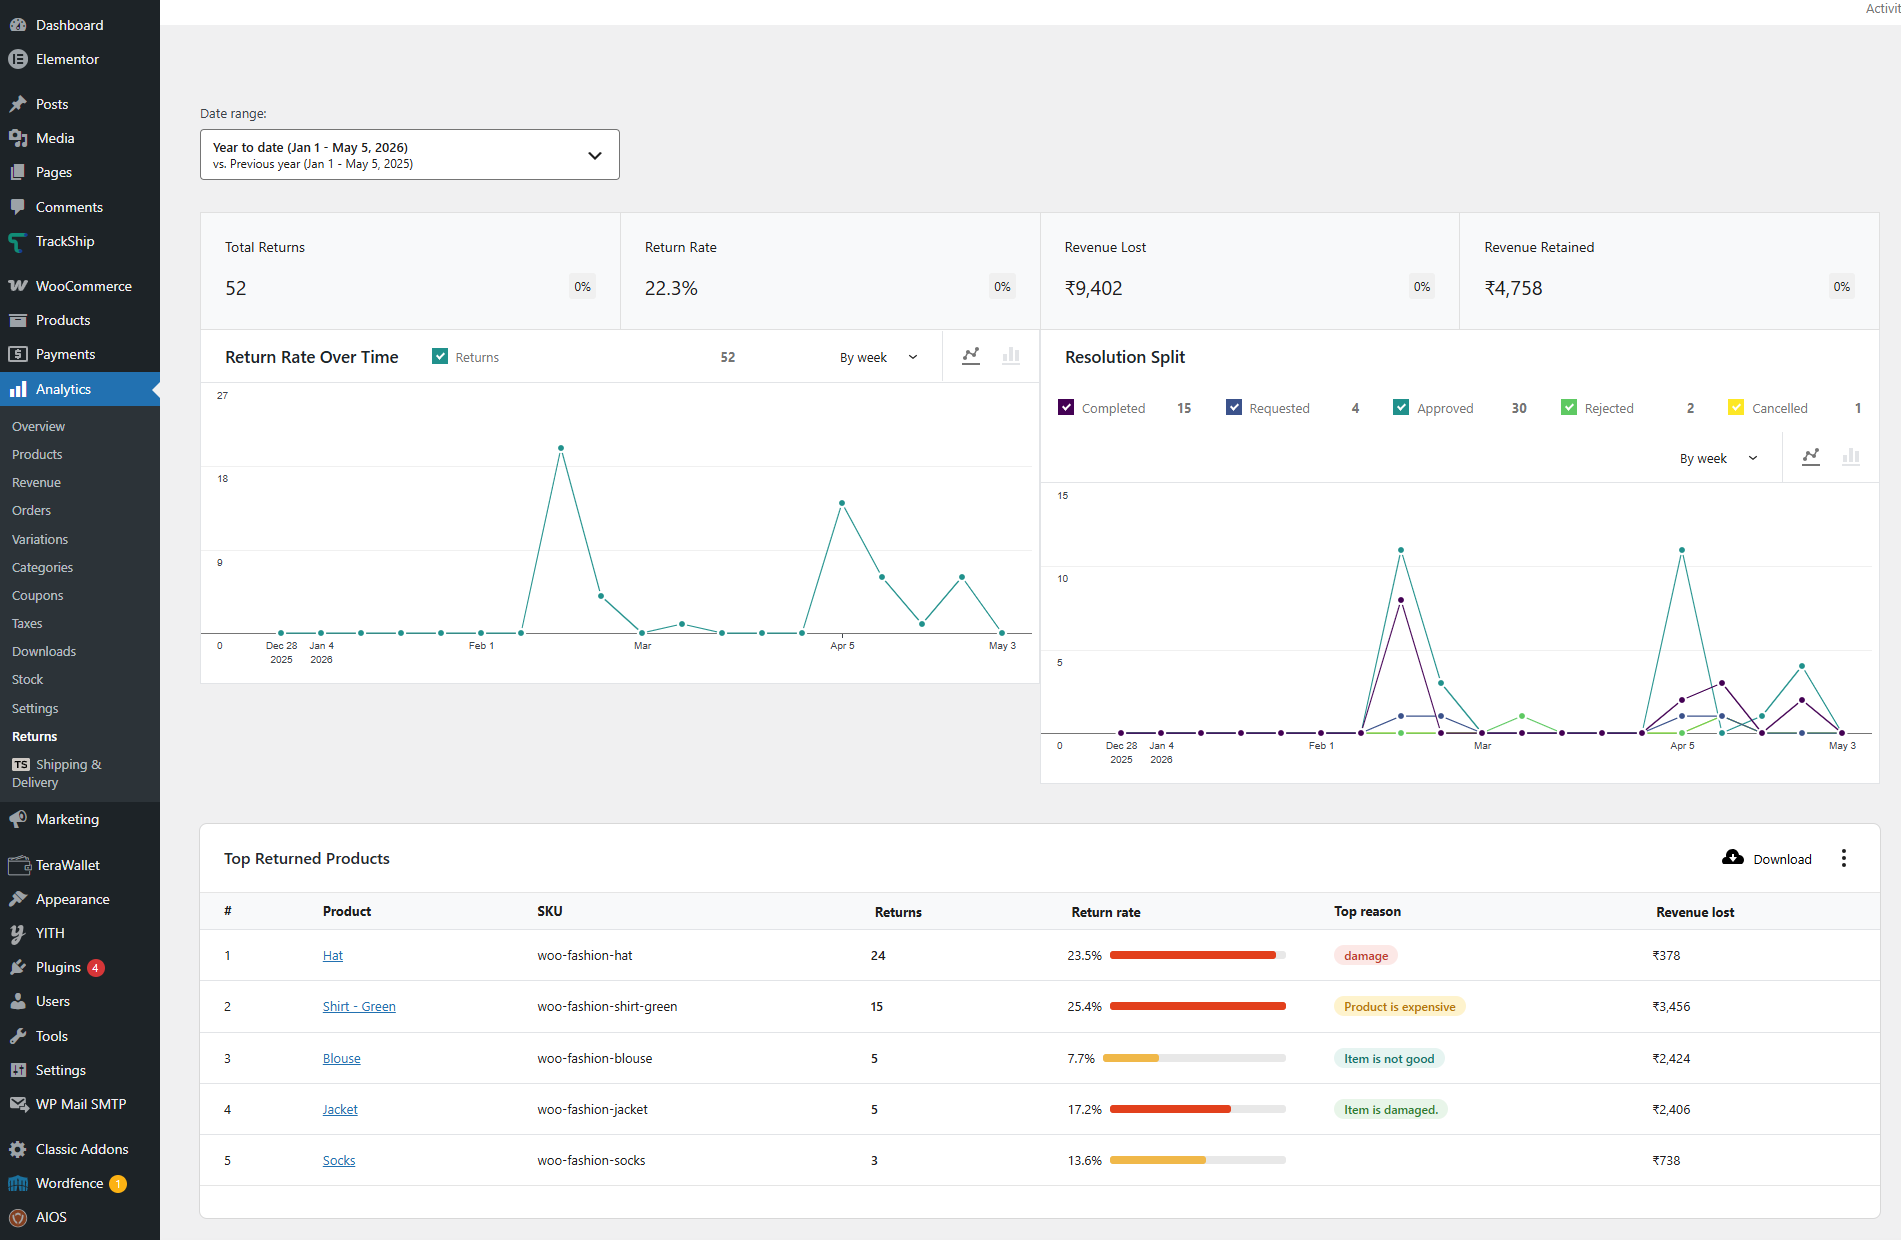
- Total Returns: Shows the total number of return requests submitted within the selected date range, with a percentage change compared to the previous period.
- Return Rate: Displays the percentage of orders that resulted in a return, calculated as
(total returns / total orders) × 100. - Revenue Lost: The total order value of returns that have been approved or completed (i.e. revenue that was refunded to customers).
- Revenue Retained: The total order value of returns that did not result in a full refund — for example, returns resolved through exchange, store credit, or that are still pending or rejected.
- Return Rate Over Time Chart: A trend chart showing return volume across the selected period. You can switch between line and bar chart views, and group data by day, week, month, or quarter (depending on the date range selected).
- Resolution Split Chart: A breakdown chart showing how returns were resolved — Completed, Requested, Approved, Rejected, and Cancelled — over the selected period.
- Top Returned Products: A ranked table listing the products with the highest return counts. Each row includes the product name, SKU, number of returns, return rate (with a visual indicator), top return reason, and total revenue lost from that product.
- CSV Download: Export the Top Returned Products table as a CSV file for offline analysis or reporting.
Reading the Top Returned Products Table
The Top Returned Products table ranks products by total return count for the selected date range. Each column gives you actionable data to identify products that need attention.
- # – Rank position based on return count.
- Product – The product name. Clicking the name opens the product edit screen in WooCommerce.
- SKU – The product’s Stock Keeping Unit, useful for cross-referencing with inventory or supplier data.
- Returns – The total number of times this product was returned during the selected period.
- Return rate – The percentage of this product’s orders that were returned, displayed with a colored bar (green for low, yellow for moderate, red for high return rates).
- Top reason – The most frequent reason customers gave for returning this product (e.g. “Product damaged”, “Wrong size”, “Item is not good”).
- Revenue lost – The total order value of all approved/completed returns for this product.
Exporting Data
To export the Top Returned Products table for use in spreadsheets or external reports, click the Download button at the top right of the table. A CSV file will be generated containing all columns from the table for the currently selected date range.
The exported file is named using the format returns-analytics-[start-date]-to-[end-date].csv, making it easy to keep track of multiple exports.